A sustainable coolant strategy for deep hole drilling needs a declared resource quantity and a delivered result. Less circulating flow, less purchased fluid and less system electricity are different claims. Retain those boundaries before describing a process as resource-saving.
Circulation is not net consumption
A recirculating flow rate describes fluid passing through the system per unit time. Net additions, replacement and removed fluid describe another accounting boundary. Multiplying circulating flow by operating hours does not establish purchased-fluid consumption.
For a proposed change, record the actual carrier/lubricant additions and system electricity separately from the tool’s supply flow. Include the operations necessary to deliver the inspected bore when the comparison concerns production output.
What the ejector study compares
The 2025 optimized ejector-head paper examines chip transport through numerical and physical investigations of defined head geometries. It compares minimum supply conditions for its experimental process and evaluates hydraulic supply energy.
That comparison does not measure whole-machine electricity, net lubricant purchasing or a complete life-cycle burden. It also concerns prototype head modifications rather than a general instruction to reduce flow in an existing ejector assembly. Preserve the actual head, medium and test scope.
Cryogenic delivery adds another resource boundary
The 2026 Inconel 718 cMQL experiment separately examines lubricant discharge and CO₂ flow. Higher pressure changes delivery but does not significantly improve tool life for the tested lubricants. A resource comparison should therefore include measured carrier use rather than assuming the higher-pressure condition buys a life gain.
These are experimental findings in a 2 mm twist-drill setup, not a full environmental comparison with a production flood-coolant route.
Divide by the same accepted output
Consider an explicitly fictional accounting example:
| Run | Declared system electricity | Accepted bores | Electricity per accepted bore |
|---|---|---|---|
| A | 20 kWh | 100 | 0.20 kWh |
| B | 18 kWh | 80 | 0.225 kWh |
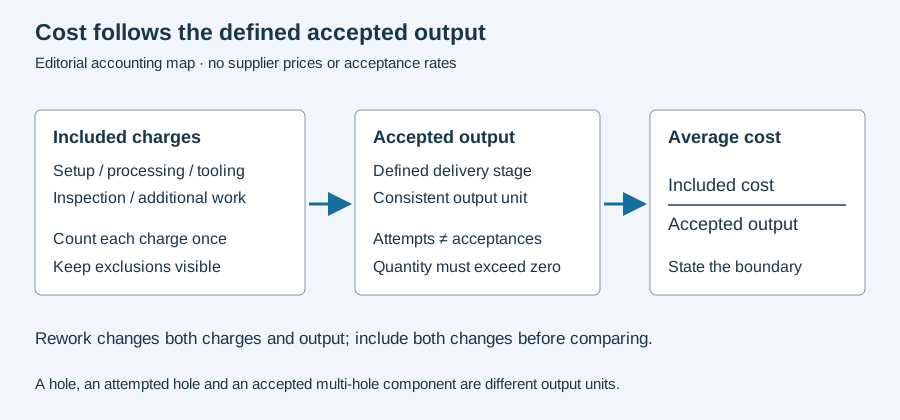
Run B uses less total electricity but more per accepted bore. The example contains no measured case and does not establish the reason for the differing acceptance counts. It shows why a resource total and a production denominator must remain together.
Use the accepted-output calculator below for the declared cost boundary; it does not perform a life-cycle assessment. Continue to coolant optimization for delivery measurements, or cost-per-hole analysis for the production route and denominator.
Revision note
October 8, 2026: revised the technical explanation and connected reading after source review. Original publication date and URL retained.