A simulated improvement needs a physical comparison. In Rupasinghe and colleagues’ ejector-head investigation, one candidate failed during drilling while another proceeded to the minimum-flow comparison. That difference explains the result more clearly than the largest reported percentage alone.
Which designs reached the flow comparison?
The experimental section of the preprint describes a reference head and modified chip mouths. The narrowed-mouth candidate repeatedly failed at the outer cutting edge. The subsequent minimum-flow comparison therefore concerned the reference and extended-mouth heads, rather than two equally successful proposed designs.
This failure belongs in the interpretation: a favorable computed flow pattern had not resolved every physical chip-transport question. For the modeled assumptions, read how SPH and chip motion were represented.
Read Table 3 as a defined endpoint
The final comparison used a 30 mm head and 42CrMo4+QT steel. Table 3 reports the following minimum flow rates at the study’s stable-process endpoint:
| Cutting speed | Reference head | Extended-mouth head | Reported flow reduction |
|---|---|---|---|
| 60 m/min | 29.5 L/min | 24.7 L/min | 16.27% |
| 80 m/min | 51.5 L/min | 29.5 L/min | 42.72% |
The approximately 43% figure describes the higher-speed row. It is neither a common outcome at both speeds nor a recommendation to set another installation to 29.5 L/min. Keep the endpoint, tool, material and cutting conditions with the table when citing it.
What the result leaves open
Minimum stable flow answers a chip-transport question. It does not measure the same percentage reduction in whole-machine electrical energy. The energy interpretation separates those quantities and explains why the meter boundary matters.
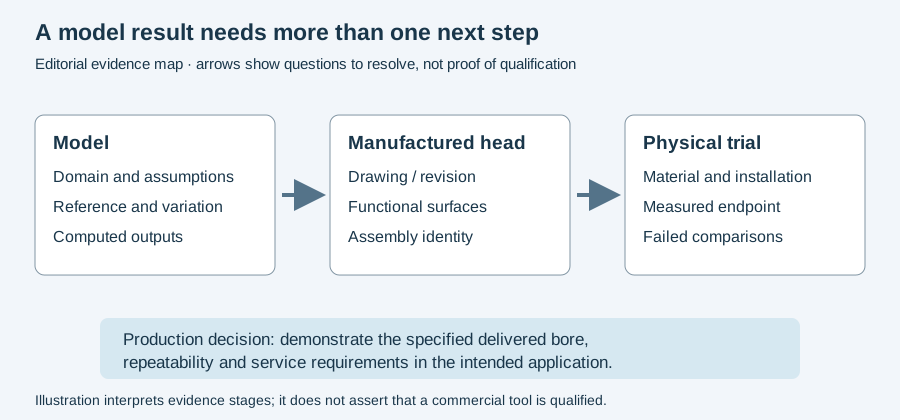
A transfer investigation must also define its delivered-bore requirements. Different head manufacture, material condition, tubes or supply arrangement form a new combination. The evidence map below separates model, manufactured configuration and physical outcome so those differences remain visible. Use the application worksheet to retain the reference, proposed changes and unsuccessful comparisons; it does not certify a production design.
Source version
The numerical table above was checked in the August 2025 preprint. The journal article was published on February 23, 2026. The year within a DOI is not the article’s publication date. This page identifies the version used for the figures rather than merging dates or silently treating the preprint as an independently replicated result.
Revision note
October 8, 2026: revised the technical explanation and connected reading after source review. Original publication date and URL retained.