Ask which production population the index describes
Identify the measured characteristic, drawing limits, units, part revisions, machine/setup, tool history and material lots. Keep observations in production order. A figure without this population definition is hard to compare with another supplier’s claim.
Review stability before capability
NIST’s stability guidance treats stability as a prerequisite for capability assessment and discusses time-ordered plots. The VDA QMC German/English glossary likewise describes capability for a controlled process. Its named sector references must not be generalized into a deep-hole-wide acceptance threshold.
Our editorial review: retain tool-change, material-lot and setup events alongside observations. If the record mixes different conditions, explain the grouping before presenting one combined index. Do not delete inconvenient observations without a documented reason and retain their disposition.
Read Cp and Cpk together
For a suitable two-sided characteristic under the assumptions discussed in the NIST capability reference, the familiar estimates are:
1Cp  = (upper limit − lower limit) / (6 × s)
2Cpk = min(upper limit − mean, mean − lower limit) / (3 × s)
Document what the estimate s represents. Do not silently switch estimators, populations or distribution assumptions between reports. A characteristic with a different distribution or one-sided specification needs the appropriate analysis rather than blind reuse of this example.
For assumed limits 9.95–10.05 mm, mean 10.01 mm and s = 0.01 mm, Cp is approximately 1.67 and Cpk approximately 1.33. If the assumed mean moves to 10.03 mm with the same s, Cp stays approximately 1.67 while Cpk falls to approximately 0.67. This illustrates centering; neither case is an actual production trial or a prescribed pass/fail rule.
Review the report, not just its headline
| Report item | What should be explicit |
|---|---|
| Requirement | Characteristic, drawing revision and specification limits |
| Sample | Counts, period, order and inclusion/exclusion reasons |
| Production | Tool, machine, material and changes during the period |
| Measurement | Procedure, coverage and adequacy for this characteristic |
| Statistics | Stability review, distribution assumptions and estimator |
| Interpretation | Agreed target, uncertainty of the estimate and limitations |
Specification limits describe the requirement; control limits describe the observed process analysis. Do not substitute one for the other or widen the drawing because of a capability calculation. No universal Cpk target or sample count is prescribed here. Link the report to the acceptance worksheet.
Read tool-change events beside the distribution
Suppose an explicitly assumed diameter series contains observations before and after a tool-service event. Keep the event in the time-ordered record. A combined histogram hides the order; an index calculated from it does not explain whether the event accompanied a change in location or spread.
Review the time history before deciding what population a capability estimate describes. If separate conditions are analyzed, identify their boundaries and avoid presenting the favorable subset as the whole delivered population. Conversely, dividing a series solely to obtain a better index does not establish a physical population distinction.
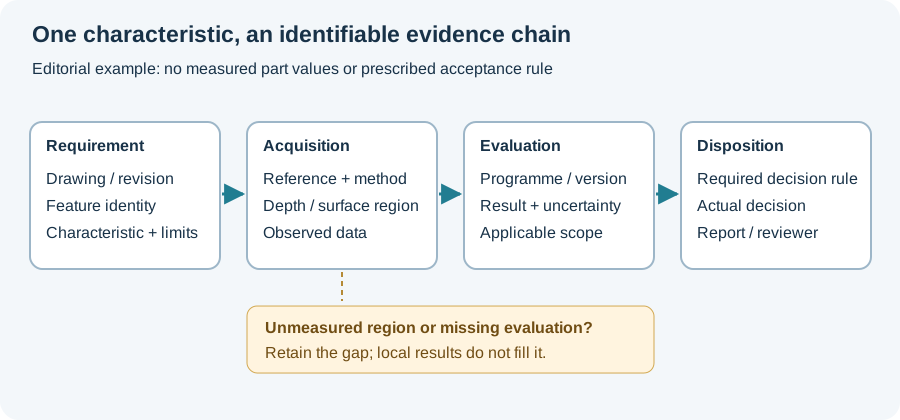
This is an editorial reading example, not a measured service effect. The requirement, measured characteristic and analysis assumptions remain attached to each estimate. The report-chain figure links the observations to the characteristic; continue to uncertainty for the measurement contribution or first-article inspection for a different kind of release evidence.
Revision note
October 8, 2026: revised the technical explanation and connected reading after source review. Original publication date and URL retained.