A roughness-related model output can be a class, a numerical prediction or an anomaly flag. Those outputs require different validation. Before interpreting an accuracy score, establish which output the model produces and how the reference surface result was obtained.
What is now accessible
The publisher’s original Measurement article page, titled “Intelligent surface roughness detection for deep-hole drilling based on pyramid adaptive transformer with MSST data fusion,” carries an indexed abstract and introduction that are readable; the article body itself is not.
The accessible text describes dual-direction vibration signals from a BTA drilling system, MSST-based signal fusion and a Pyramid Adaptive Transformer. Its introduction frames the output as roughness classification and diagnosis. This establishes the authors’ described research architecture, not an independently reproduced performance result.
What remains unverified
The experimental methods, label boundaries and development/test split are not available in the readable material. This article therefore does not adopt the abstract’s numerical accuracy or model-size reduction as an evaluated production benefit; readable front matter does not close the methods gap.
No corresponding original German experiment covers the missing details. Geological well-drilling prediction and conventional drilling studies concern other tasks and cannot fill this BTA study’s validation gap.
Define the label before the score
As an editorial assessment, request the predicted quantity or class boundaries, reference measurement procedure and bore-region identity. A correct classification among defined surface classes is not automatically a small error in a roughness parameter expressed in micrometres.
Keep the signal interval connected to the surface region supplying its label. Where nearby windows from one hole share a tool history and material state, explain how the evaluation separates development information from reserved production observations. A count of signal windows alone does not describe the number of independently assessed components.
Turn the architecture into an inspectable test
Record candidate predictions before obtaining the reserved-hole inspection results. Assess the named output by the installation conditions it is intended to encounter, including unavailable signals and conditions outside the demonstrated range. The paper’s methods are not available to answer any of them here.
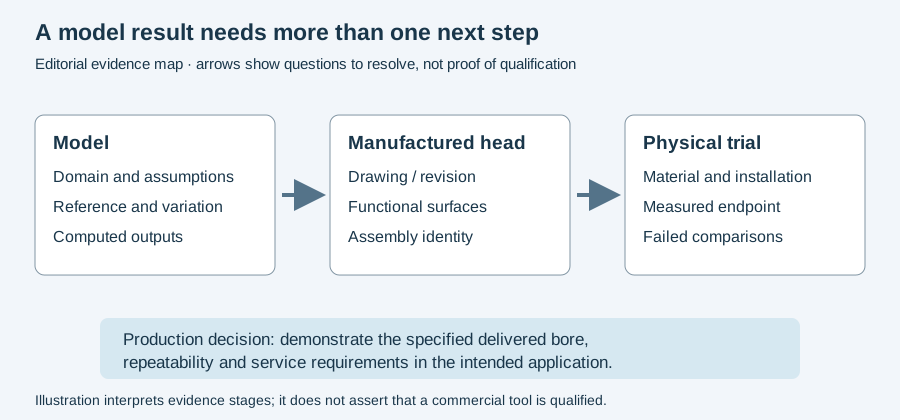
The diagram below follows a model proposal to a separately inspected outcome. Use the technical-review proposal to invite a specialist to assess a defined paper interpretation, with original sources and relevant experience. Continue to monitoring for event-based performance assessment or measurement methods for the reference surface evidence.
Revision note
October 8, 2026: revised the technical explanation and connected reading after source review. Original publication date and URL retained.