A tool-life comparison needs the same endpoint before it needs an improvement percentage. If one tool is replaced after a measured service limit and another after a planned shift, their recorded intervals describe different decisions. Coolant pressure alone cannot reconcile them.
Define supply at a named point and state
Gühring’s PQ3000 account describes checking pressure and flow with the actual tool fitted in a stationary spindle. This supplies evidence about a configured delivery arrangement. It does not establish an in-cut life relationship or the condition throughout every drilling interval.
Record tool/holder identity, fluid condition, location and operating state with the reading. Keep changes in the filter, circuit or medium visible. KNOLL’s unit description separates transfer, filtration, clean supply and high-pressure delivery; its pump-side description cannot stand in for every tool-side condition.
Keep the endpoint constant
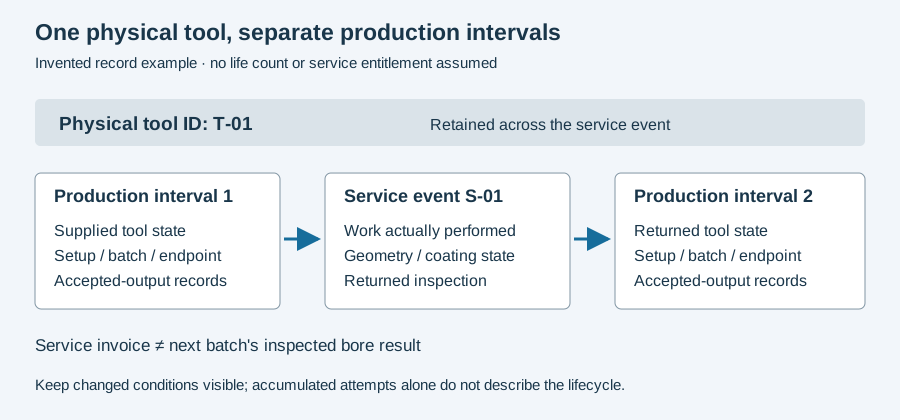
An editorial comparison should state whether the interval ends through a specified wear/service criterion, breakage or planned retirement. Keep an interrupted interval separate where its endpoint differs. Retain inspected output and material/setup identities beside the service history.
Consider an invented example: Run A finishes 100 holes before the declared endpoint, with 95 accepted; Run B finishes 110, with 90 accepted. Counting finished holes alone makes B look better. Counting accepted holes gives a different result. These assumed counts demonstrate the denominator, not a coolant trial or a wear criterion.
If B also changed the tool geometry, a pressure-only causal claim would omit another intervention. Report the complete changed configuration unless the comparison separates its effects.
Compare the complete consequence
Retain tool service, inspection, rejected or held output and the declared cost/time boundary. The accepted-output calculator below can compare those assumed costs once their scope is defined. It cannot select pressure or predict a tool’s life.
The service-interval figure links edge condition and production history. Continue to coolant tracing if delivery is unresolved, or process optimization to compare the route’s sustained accepted output.
Revision note
October 8, 2026: revised the technical explanation and connected reading after source review. Original publication date and URL retained.